ClimateVisualizer
Digital and local carbon budgets as a cloud service to municipalities, regions and their inhabitants
ClimateVisualizer (CV) is a research-based tool that establishes digital and local carbon budgets as a cloud service to municipalities, regions and their inhabitants. With the launch of CV the carbon budget concept is transformed from a scientific model intended for decision-makers, to an interactive information service that citizens and civil society can follow and understand on the Internet. What they then follow is the scientific path towards the Paris Agreement and the global temperature goals.
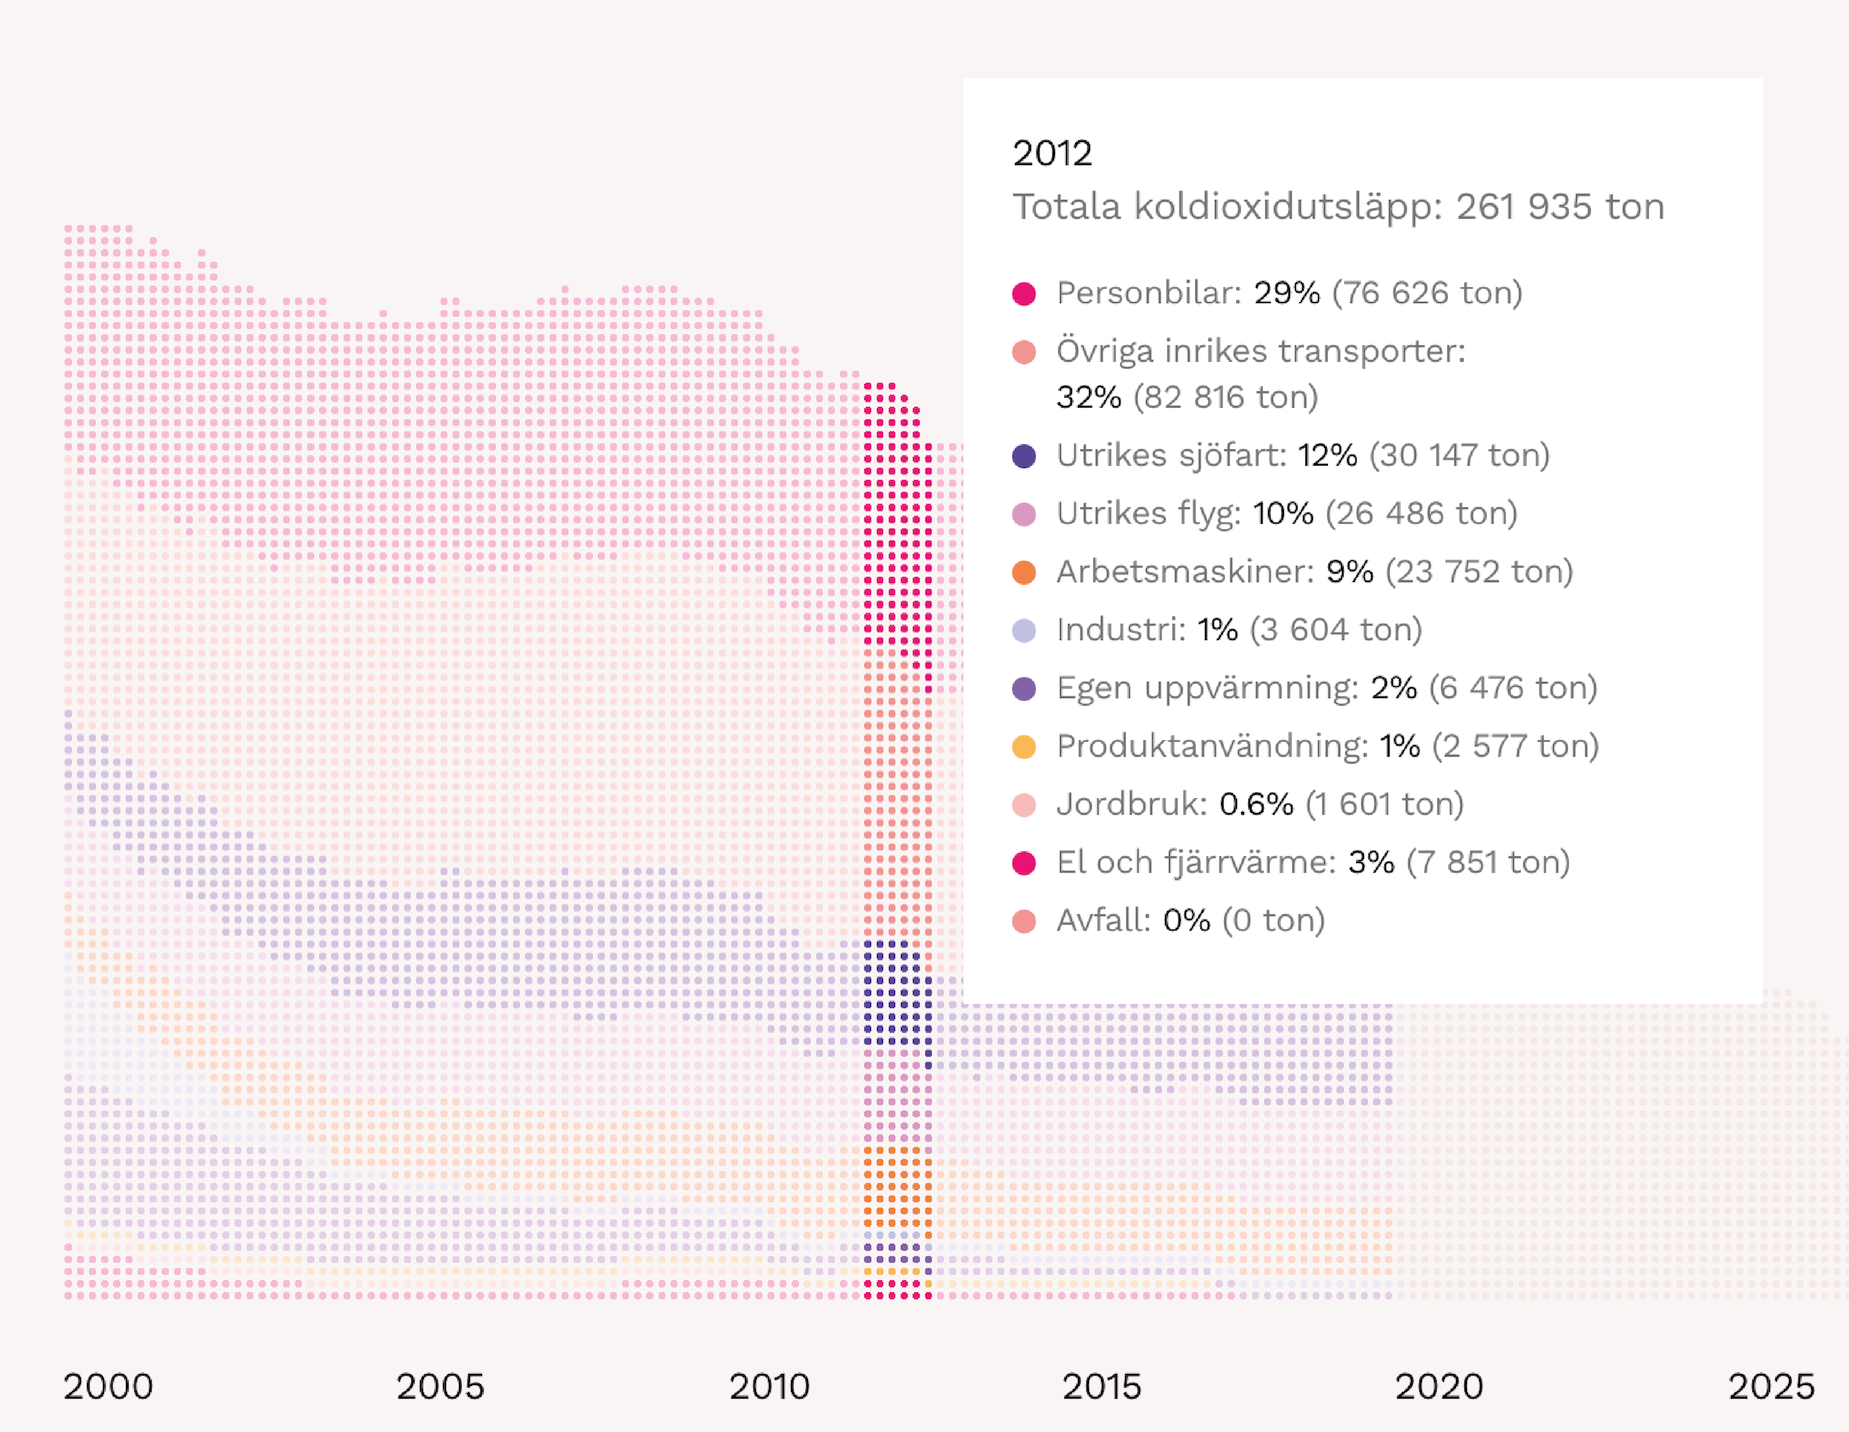
A local carbon budget gains from being considered in a local statistical context that, for instance, highlights emission trends, allows them to be extrapolated into the future, and educationally shows various greenhouse gases and emissions sectors. CV also offers this context, by repackaging our world-leading Swedish climate statistics in a new way. This is done by taking advantage of many of the possibilities of digitalisation to create interactive interfaces and visualize data, but also by a novel focus on the local user’s information needs.
Today there are two frameworks that give us different climate goals: a supranational where the Paris Agreement gives us global temperature targets and a national/local that produces emissions reduction targets. By applying official Swedish climate statistics to a more scientific framework (the local carbon budget), and visualizing the statistics both cumulatively and non- cumulatively, CV allows the user to evaluate to what extent local emissions and targets are compatible with the Paris agreement. Hereby the project strengthens confidence in climate statistics and associated authorities, while at the same time creating transparency relative to the various climate targets.

